GeoNode Help
This page provides helpful information about how to use the iAtlantic GeoNode. You can use the sidebar links to navigate to what you want to know.
The iAtlantic GeoNode provides access to data sets and a map editing application allows users to browse existing maps and contribute their own.
Workshops
iAtlantic General Assembly 2020
A first workshop on how to work with the iAtlantic GeoNode was organised during the 2020 iAtlantic General Assembly. You can find the recording here.
iAtlantic General Assembly 2022
We are planning a second workshop on the iAtlantic GeoNode during the upcoming iAtlantic General Assembly in Brazil.
GeoNode terminology
Layers
Layers are a primary component of the GeoNode. They are publishable resources representing a raster or vector spatial data source which can be associated with metadata, ratings, and comments.
Documents
Documents are any other files (e.g. images, reports, publications, presentation etc.). They can be associated with metadata, ratings and comments, and can be linked to specific data layers or maps.
Remote Services
In GeoNode, externally hosted data layers can be added through remote services. GeoNode supports the following web service protocols:
- OGC Web Map Service
- ArcGIS REST Map Service
Maps
Maps are combinations of various layers and their styles. They are fully interactive and can combine both locally uploaded layers in GeoNode as well as layers from remote services. Maps also contain other information such as map zoom and extent, layer ordering, filters, style and associated widgets.
How to search for data
From the iAtlantic GeoNode homepage you can use the search box to find layers, maps and documents that contain any matching text in the associated metadata. The study area buttons allow you to search layers, maps and documents that overlap with the geographic extent of each of the iAtlantic Study regions. To browse through all layers, maps or documents, you can access the Data > Layers tab, the Maps > Explore Maps tab or the Data > Documents tab respectively.

This will open a search page which lists all layers, maps or documents that match you query. You can order the list of data by date, name or popularity. You can further refine your search using the different dropdown menu's on the right, which allow to filter by:
- Text: all metadata field text search
- Keywords: one or more hierarchical keywords
- Type: the data type (raster, vector, remote, map or document)
- Category: the standard ISO Geospatial Topic Category
- Owners: the provider, creator or distributor of the data
- Groups: the GeoNode groups to which data provider, creator or distributor belongs (e.g. their institute)
- Group Categories: The category to which this group belongs
- Date: The date when layer, map or document was published
- Region: The standard region associated which the layer, map or linked document
- Extent: The geographic extent of the layer, map or document that overlaps with the extent of the interactive mini-map. Pan and zoom in the mini-map to refine your search.

How to visualise data and metadata
Clicking on the data layer of interest will open up the layer overview page. An interactive map allows you to visualise the data layer. You are able to pan and zoom as well as interact with the data by clicking a specific feature or location on the map. This will return the attributes (in case of vector type data) or the value (in case of raster type data) of the selected feature or location. The background map can be altered by clicking the background layer thumbnail in the lower right and selecting the background layer of choice. On the right, you can view the legend for the data, links to maps that are using this layer, the available styles for the layer, and the data owner, point of contact and metadata author.

Below the map, under the Info tab, you are able to view basic metadata of the layer like title, license, abstract, publication date, keywords, category, region and owner. To view the full set of metadata, click on the "Metadata Detail" button in the top right. Under the attributes tab, you find additional metadata on the attribute fields (in case of vector type data). Social features are offered throught he Share, Ratings, Comments tabs. Under the favorites tab, you can add the map to your GeoNode profile for easy access.
How to download data and metadata
Given you have the permissions, the data can be downloaded through the "Download Data" button in the top right. This will open the download menu.
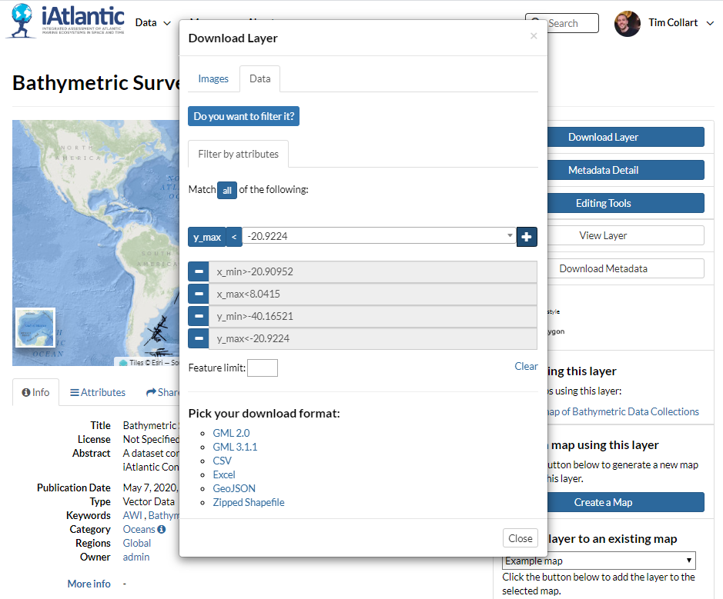
Under the Images tab, you have the option to download a georeferenced image of the data in following formatis:
- JPEG
- PNG
- GeoTIFF
- GZIP compressed ESRI ARC/INFO ASCII GRID
- Zipped ESRI Shapefile
- GML 2.0
- GML 3.1.1
- CSV
- Excel
- GeoJSON
The metadata of a layer can be downloaded through the "Download Metadata" button in the top right. This will open the metadata download menu.

From this menu, the full metadata can be downloaded for viewing in simple text or html format. Furthermore, following standard metadata xml formats for machine parsing are supported:
- ISO
- FGDC
- ebRIM
- Dublin Core
- DIF
- Atom
How to create an interactive map
To create a new map, click the Maps > Create Map tab while logged into your iAtlantic GeoNode account. Alternatively, from the layer search page, click the "+" icon next to the layers you wish to combine in a map. The selected maps are listed in the top left. To combine them in a map, click "Create a Map".

This will take you to the Map Composer with a base layer loaded. The basemap can be changed by clicking the background layer thumbnail in the lower right and selecting the background layer of choice. Open the layer menu by clicking the layers icon in the top left.

To add data layers from the GeoNode click on the green plus button located below the layers tab on the left hand side of the screen. This will open a dialog listing all the layers available on the GeoNode.
To add layers to your map select them and hit the Add Layers button. When finished you may hit Done to close the dialog and go back to the map.
Reordering and Removing Layers
Change the display order of the layers listed in the data tab by simply dragging and dropping their names. The order in the map will be updated to reflect that. To turn a layer's visibility off simply uncheck it, and to remove it entirely select it and hit the red minus button.
Saving your map
Once a suitable set of layers and zoom level has been found it's time to save it so others can see it. Click the Save button--the left most icon on the top toolbar, an image of a map with a disk--on the top menu and fill out the title and abstract of the map.
Publishing a Map
Any map from the GeoNode can be embedded for use in another site or blog. To publish a map:
- Select the from the list of maps on the community or map page and then hit the 'Publish map' button.
- Choose your desired height and width for the widget in the wizard.
- Copy the HTML snippet provided in the wizard to any HTML page or iFrame-supporting blog post.
This will put an interactive widget showing you map in your web page or blog post.
Note that the Map Composer also has a button to publish the map. Just be sure to save the map before publishing if there are changes that you want others to see. It publishes the last saved version, not the last viewed version.